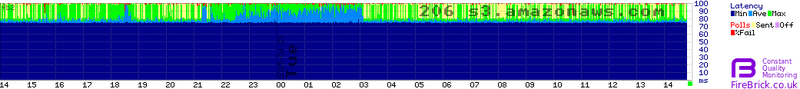
The FireBrick provides Constant Quality Monitoring. The main purpose of this is to provide a graphical representation of the performance of an interface or traffic shaper - typically used for broadband lines on L2TP or as ping results to specified endpoints.
- 100 second interval statistics available graphically as svg or png and in text as csv covering at least the last 25 hours (one day)
- Loss latency stats where available (e.g. LCP echos on L2TP broadband lines) including minimum, average, and maximum latency for the 100 second sample, and percentage packet loss.
- Throughput stats where available (e.g. interfaces, shapers , L2TP broadband lines ) including average tx and rx rate for 100 second sample
Graphs can be loss/latency or throughput of both. A ping only system would only have loss/latency. An L2TP broadband line has both. An interface or shaper normally has only throughput data.
Ping graphs can be created in 5 main ways.
- Defining <ping.../> elements in the config for each graph
- Specifying a <ping-url='...'/> attribute in the cqm config to read a bulk list of pings
- Using the web interface's ping form (Graphs/Ping) to specify individual addresses to ping
- Using the web interface's ping form to read a bulk list of pings from a specified URL
- Making automated HTTP/HTTPS requests to specify individual addresses to ping
Number of ping targets.
- You can specify a maximum of 2,000 pings in the config.
- You can specify more if you specify a bulk ping-url URL.
- Depending on what else the FireBrick is doing the maximum suggested limit would be around the 2,000 mark.
- Loading 100s of graph images over https will be very slow, using plain http would be recommended for units with a large number of graphs.
- In practice, you can add more than 2,000 graphs, but the FB2900 will be CPU bound when doing other activities (eg downloading graph data) and ping data may be lost.
- For more than 2,000 graphs, we'd suggest using a FB9000 device.