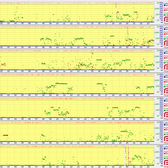
The FB9000 is designed to ping things. It can ping lots of hosts (IPv4 and IPv6) and create CQM graphs showing loss and latency, and jitter. Typical applications include a broadband ISP monitoring lines for problems as well as central monitoring of equipment and servers and network links.
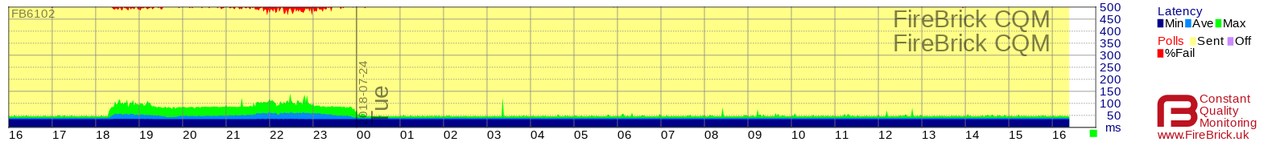
For each ping sent, the loss and latency is recorded. Latency is recorded as min/max/average for each 100 second sample. png and svg image files are created and XML files are also produced which will have a line per 100 pings as follows:
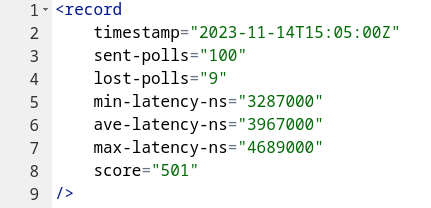
The xsd for this file is also published.
The FireBrick can also assign scores to each 100 second sample. The basis of the score can be customised - eg weighted towards loss or towards latency. This can be used when post-processing the data.
When downloading graphs, various options can be given to customise the style and colours.
We're happy to discuss individual customer requirements with respect to managing ping data etc, please do get in touch.
Ping graphs can be created in a few ways:
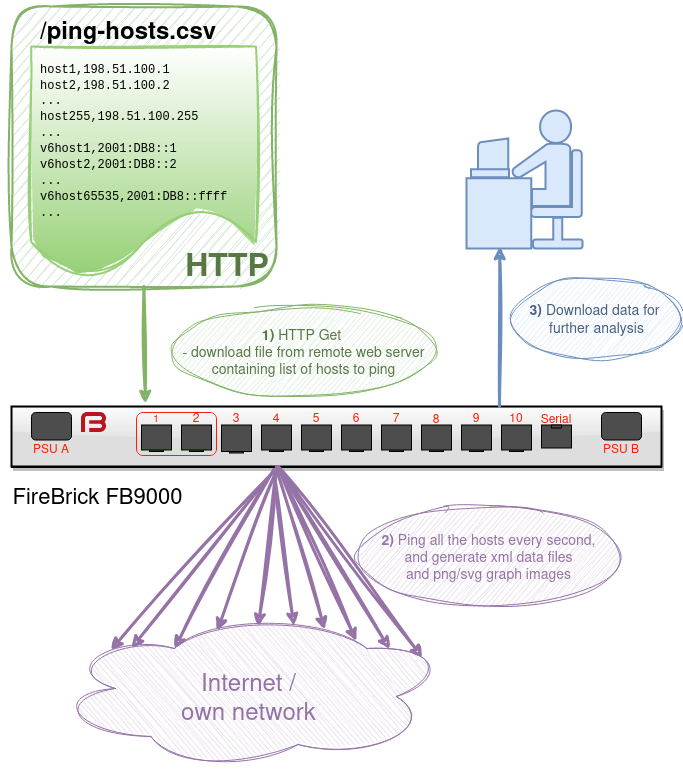
Graphs and xml data can be viewed and downloaded via the FireBrick's web interface. However, downloading a large number of data items is better done via scripts to retrieve the data you want. You can then store the images offline or post-process the xml data as required.
The manual has more details, but by generating URLs you are able to bulk download the data as well as specify specific options for the data you are downloading, such as date/time ranges, text overlay and colours and other parameters.
Can the FB2900 be a ping server too?
Yes, the FB2900 model can also generate ping graphs, but for a lower number of endpoints.
What is a ping?
Ping is a network utility to see if a remote host responds. By pinging a host you are able to determine the latency (the time it takes to get there and back) and if there is packet loss or jitter. An actual ping packet is an ICMP (internet Control Message Protocol) or ICMPv6 (for IPv6 hosts) packet. The remote host sends back a a reply, and calculation on the timings can be made to measure loss and latency.
Smokeping Vs FireBrick ping
Both smokeping and FireBrick's ping graphs show loss and latency. There are some differences though:
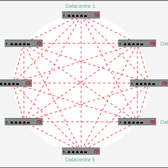
How to ping a million hosts?
Can a FireBrick ping a million hosts? A single FB9000 can ping up to 100,000 hosts, so you'd need 10 units to ping a million! Work has been done to improve this 100k figure, so do get in touch if you're needing to ping this many or more.
What ping size is used?
The payload size can be defined, so you can have multiple entries for a host, specifying different payload sizes.
Full features for one price, no per session licencing or other extra costs.
Five year warranty on hardware against any manufacturing defect. Normal working hours / courier replacement. Recommended that two units are used together to provide hardware redundancy. On-going maintenance contracts available for extended hardware support beyond one year.
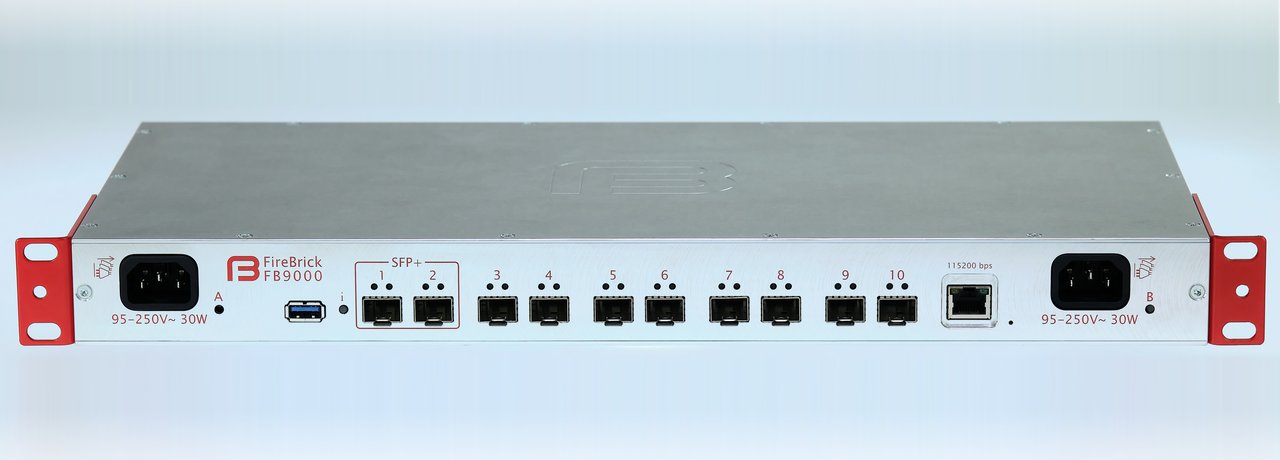
1U, dual AC 120/240V inlets (monitored), 2 internal fans (monitored), approx 30W total power consumption.
Multi-position 19" rack mount ears, with variation for hanging mount in shallow depth telco racks.
Software upgrades
Free of charge, beta and released software. Internal flash holds up to 8 versions with automatic fallback on crash/watchdog.
Reboot or software upgrade with clean shutdown of L2TP, BGP, VRRP, etc, for minimal disruption. Boot time under 1 second.
UK based s/w support team - email and irc support during office hours.
Configuration defined by an XML document according to a published XSD schema. The configuration may be uploaded and downloaded by HTTP (e.g. using curl). In addition the web interface contains an interactive configuration editor.
Configuration changes are applied as seamlessly as possible when loaded without the need to re-boot.
The command line provides a number of commands to provide viewing of BGP, and pinging status data, as well as clearing BGP sessions. Includes tab completion and interactive help text.
Two 10G SFP+ ports and eight 1G SFP ports allowing 4096 VLANs on each. 100 independent routing tables which can be used with BGP. Each port/VLAN can be attached to a specific routing table.
Access lists of telnet, ssh, tftp, web, snmp. These can also be attached to an independent routing table for specific port/VLANs.
Syslog to external server with various levels of debugging data available. Logs also available live via command line interface.
CQM (Constant Quality Monitoring( provides graphs for last day, and for nightly archive.
SNMP (read only) support for a number of functions including interface stats for each port/VLAN in use and individual ping state (up/down).
Simple NTP client to set clock for accurate logging with fallback via list of configured servers.
DHCP client mode available, multiple instances. Also RA client for IPv6 addressing.
RA server for passive IPv6 adress allocation to LAN.
IPv4 VRRP2 and IPv4/6 VRRP3 server.